Posted by Teppei Yagihashi, Solutions Architect, Google Cloud Platform
At Google I/O 2016, we launched a significant new release of Firebase that consolidates several of Google’s mobile offerings into a single product. The new Firebase reduces the complexity of building mobile client and backend services and provides tools to help you grow your user base, earn revenue from your app and collect and analyze app-event data.Read More
Posted by Teppei Yagihashi, Solutions Architect, Google Cloud Platform
At Google I/O 2016, we launched a significant new release of Firebase that consolidates several of Google’s mobile offerings into a single product. The new Firebase reduces the complexity of building mobile client and backend services and provides tools to help you grow your user base, earn revenue from your app and collect and analyze app-event data.
With Firebase, you can easily build a scalable and loosely coupled system. For example, you can add iOS or web clients without any impact to existing Android clients. If you need backend services, App Engine Flexible Environment can add new backend capacity automatically.
By storing data in the Firebase Realtime Database, the Android client app exchanges chat messages with other users and also pushes user-activity logs, such as sign-in and sign-out events and channel-change events, to Java Servlet instances in real-time.
In the sample code, the Servlet instances simply cache activity logs in memory, but that's just a small part of what you can do with Firebase and App Engine Flexible Environments. For example, Servlet instances can be used for:
Heavy and asynchronous backend processing— Tasks that are too resource-intensive to run on client devices can be processed asynchronously by a backend service.
Real-time fraud detection— Servlets can detect user events from multiple devices in a short period of time.
ETL processing — A backend service can pass user-event logs to other data stores such as Google BigQuery, for advanced analysis.
Posted by Alan Chin-Lun Cheung, Google Submarine Networking Infrastructure
Today, Google’s latest investment in long-haul undersea fibre optic cabling comes online: the FASTER Cable System gives Google access to up to 10Tbps (Terabits per second) of the cable’s total 60Tbps bandwidth between the US and Japan. We'll use this capacity to support our users, including ...Read More
Posted by Alan Chin-Lun Cheung, Google Submarine Networking Infrastructure
Today, Google’s latest investment in long-haul undersea fibre optic cabling comes online: the FASTER Cable System gives Google access to up to 10Tbps (Terabits per second) of the cable’s total 60Tbps bandwidth between the US and Japan. We'll use this capacity to support our users, including Google Apps and Cloud Platform customers. This is the highest-capacity undersea cable ever built — about ten million times faster than your average cable modem — and we’re beaming light through it starting today.
This is especially exciting, as we prepare to launch a new Google Cloud Platform East Asia region in Tokyo later this year. Dedicated bandwidth to this region results in faster data transfers and reduced latency as GCP customers deliver their applications and information to customers around the globe.
The FASTER Cable System is just the latest example of Google’s ongoing investments in internet infrastructure. We were the first technology company to invest in undersea cable back in 2008, with the 7.68Tb trans-Pacific Unity cable, which came online in 2010. Today’s completion brings the global number of Google-owned undersea cables up to four, with more (under) the horizon.
Google's one of six members of the FASTER Consortium, with sole access to a pair of 100Gb/s x 100 wavelengths optical transmission strands between Oregon and Japan — one strand for sending and one for receiving.
In addition to greater bandwidth, the FASTER Cable System also brings valuable redundancy to the seismically sensitive East Asia region. The cable utilizes Japanese landing facilities strategically located outside of tsunami zones to help prevent network outages when the region is facing the greatest need.
Google, in collaboration with GitHub, is releasing an incredible new open dataset on Google BigQuery. So far you've been able to monitor and analyze GitHub's pulse since 2011 (thanks ...Read More
Google, in collaboration with GitHub, is releasing an incredible new open dataset on Google BigQuery. So far you've been able to monitor and analyze GitHub's pulse since 2011 (thanks GitHub Archive project!) and today we're adding the perfect complement to this. What could you do if you had access to analyze all the open source software in the world, with just one SQL command?
The Google BigQuery Public Datasets program now offers a full snapshot of the content of more than 2.8 million open source GitHub repositories in BigQuery. Thanks to our new collaboration with GitHub, you'll have access to analyze the source code of almost 2 billion files with a simple (or complex) SQL query. This will open the doors to all kinds of new insights and advances that we're just beginning to envision.
For example, let's say you're the author of a popular open source library. Now you'll be able to find every open source project on GitHub that's using it. Even more, you'll be able to guide the future of your project by analyzing how it's being used, and improve your APIs based on what your users are actually doing with it.
On the security side, we've seen how the most popular open source projects benefit from having multiple eyes and hands working on them. This visibility helps projects get hardened and buggy code cleaned up. What if you could search for errors with similar patterns in every other open source project? Would you notify their authors and send them pull requests? Well, now you can.
Some concepts to keep in mind while working with BigQuery and the GitHub contents dataset:
The contents table has all the non-binary files in GitHub that are less than 1MB. It's a huge table, with more than 1.5 terabytes of data! This means the monthly terabyte for BigQuery queries won't last long if you want to query this table. To make your life easier, we've created extracts with only a sample of 10% of all files of the most popular projects, as well as another dataset with all the .go, .rb. .js, .php, .py, and .java code. Use them to make your free quota last!
If these tables are not enough, you can always create your own extracts (but you'll be billed for the respective storage). To do so, you could sign up for $300 in Google Cloud Platform credits. These credits could be used to store terabytes (and more) of data in BigQuery.
BigQuery makes it easy to join different datasets. How about ranking coding patterns by the number of stars their projects get? See a related post looking at the Hacker News effect on a project’s GitHub stars.
SQL is not enough? Learn how BigQuery allows you to run arbitrary JavaScript code inside SQL to enable a full range of possibilities.
Posted by Alex Barrett, Editor, Google Cloud Platform Blog
Ah, summer . . .the time for sitting on the beach, kicking back and . . . learning about Google Cloud Platform ...Read More
Posted by Alex Barrett, Editor, Google Cloud Platform Blog
Ah, summer . . .the time for sitting on the beach, kicking back and . . . learning about Google Cloud Platform. Our developer advocates never rest, and will be traveling to the four corners of the earth to teach you about their favorite GCP features. Here are a few highlights for the coming month:
ContainerCon, Tokyo, Japan
Jul 12, 2016 - Jul 14, 2016
In the Far East? Ian Lewis will deliver a talk, “Building and Deploying Scalable Microservices with Kubernetes” and Google open source advocate Marc Merlin talks about “How Google Uses and Contributes to Open Source.” To register and find out more, visit http://events.linuxfoundation.org/events/containercon-japan/
EuroPython 2016 Bilbao, Spain
Jul 16, 2016 - Jul 23, 2016
Want to learn about deep learning from deep inside of Basque country? Ian Lewis discusses TensorFlow, an open-source machine learning framework, how to use it with Python, and how it compares to other Python ML libraries such as Theano and Chainer. To register, visit
Back stateside, Sandeep Dinesh delivers his talk on “Scalable Microservices with Kubernetes and gRPC.” Visit http://nodesummit.com/ for a full schedule and to register. (And if you can’t make it to San Francisco, you can also catch Sandeep’s talk on YouTube.)
So you want to build an API, and do it with microservices? Microservices are perfect for building APIs. Teams can focus on building small, independent components that perform a specific API call. You can write each endpoint in a different language, provide different SLAs and even scale the microservices independently.Read More
Posted by Sandeep Dinesh, Developer Advocate
So you want to build an API, and do it with microservices? Microservices are perfect for building APIs. Teams can focus on building small, independent components that perform a specific API call. You can write each endpoint in a different language, provide different SLAs and even scale the microservices independently.
I talk about how easy it is to deploy and run multiple services in a kubernetes cluster. This demo code shows how easy it is to launch a frontend and backend service that communicates together and scales independently.
One thing this demo didn’t really show is services written in multiple languages all working together transparently to the end user. Recently, my colleague Sara Robinson and I built a demo with the folks at NGINX that shows you how you can build such a service, and we just open sourced all the code. Read on for an in-depth writeup. (This is a long post — feel free to jump to the sections that apply to your specific needs.)
This demo relies on Kubernetes and Google Container Engine to run the cluster. Before we get started, make sure you've created a Google Cloud project. If you need to get up to speed on Kubernetes, check out this blog post.
Why we used Kubernetes
Sara and I program in a lot of different languages. Certain languages are better suited for certain problems, so it makes sense to use the best tool for the job. For example, Google runs a combination of primarily C++, Java, Python and Go internally.
Before containers and Kubernetes, this would mean setting up four different servers with four different stacks, which is a very ops-heavy thing to do. If you wanted to consolidate servers, you would have to install multiple stacks on the same machine. But upgrading one stack might break another stack, scaling the system becomes an operational challenge, and things in general become harder. At this point, many people begrudgingly choose one stack and stick with it.
With containers, this headache goes away. Containers help abstract the machines from the code, so you can run any stack on any machine without having to explicitly configure that machine. Kubernetes automates the orchestration part of the story, so you can actually deploy and manage all these containers without having to SSH into machines.
Creating a Kubernetes cluster
Let’s create a Kubernetes cluster to run our applications. Make sure you've installed the Google Cloud SDK or use Cloud Shell (and if you're new to Google Cloud, sign up for the free trial). I’m going to use a standard three machine cluster.
The code we're deploying is super simple. In each language, we wrote a different string implementation. We have four different services (click the links to see the code):
The next step is to put this code into a container. The container build process gathers all the dependencies and bundles them into a single shippable blob.
We're going to use Docker to do this. Make sure you have Docker installed or are using Cloud Shell. Docker makes it super simple to build containers and feel confident that they'll run the same in all environments. If you haven’t used Docker before, check out one of my previous blog posts that discusses running a MEAN stack with containers.
The first step is to create something called a Dockerfile. Here are the Dockerfiles we're using.
Ruby:
FROM ruby:2.3.0-onbuild CMD ["ruby", "./arrayify.rb"]
Python:
FROM python:2.7.11-onbuild CMD [ "python", "./app.py" ]
Node.js:
FROM node:5.7.0-onbuild
Go:
FROM golang:1.6-onbuild
These are all you need to install your whole stack!
Your dependencies may be a bit more complicated, but the basic idea of a Dockerfile is to write out the linux commands you want to run and specify the files you want to mount or copy into the container. Check out the Dockerfile docs to learn more.
To build the apps, run the docker build command in the directory containing the Dockerfile. You can “tag” these images so they're ready to be securely saved in the cloud using Google Container Registry.
Replace <PROJECT_ID> with your Google Cloud project ID, with a name for your container (e.g., reverser), and <CONTAINER_VERSION> with the version (e.g., 0.1)
(For the rest of this post, I’ll refer to the string
gcr.io/<PROJECT_ID>/<CONTAINER_NAME>:<CONTAINER_VERSION> as <CONTAINER_NAME> to keep things simple.)
Repeat this command for all four microservices. You've now built your containers!
You can test them locally by running this command:
$ docker run -ti -p 8080:80 <CONTAINER_NAME>
If you're running linux, you can visit your microservice at localhost:8080.
If you're not running linux, you should use docker-machine to run your docker engine (until Docker gets native support for Mac and Windows, which will be soon).
With docker-machine, get your instance name using:
$ docker-machine list
And then get your machine’s IP address using:
$ docker-machine ip <NAME_OF_INSTANCE>
You should see something like this:
Deploying containers to Google Container Engine
Now that you've built your containers, it’s time to deploy them. The first step is to copy your containers from your computer to the cloud.
$ gcloud docker push <CONTAINER_NAME>
This will push your image into a private repository that your cluster can access. Remember to push all four containers.
Now you need to deploy the containers to the cluster. The easiest way to do this is to run this command:
$ kubectl run <SERVICE_NAME> \
--image=<CONTAINER_NAME> \
--port=80
This deploys one instance of your container to the cluster as a Kubernetes deployment, which automatically restarts and reschedules your container if anything happens to it. A previous blog post discusses ReplicationControllers (the old version of Deployments) and why they're important.
You can stop here, but I like to create config files for my Deployments as it makes it easier to remember what I did and make changes later on.
Here's my YAML file for the arrayify microservice. It gives the Deployment a name (arrayify), specifies the number of replicas (3), as well as the container name and the ports to open.
apiVersion: extensions/v1beta1
kind: Deployment
metadata:
name: arrayify
spec:
replicas: 3
template:
metadata:
labels:
name: arrayify-pods
spec:
containers:
- image: <CONTAINER_NAME>
name: arrayify-container
imagePullPolicy: Always
ports:
- containerPort: 80
name: http-server
Save this into a file called "deployment.yaml" and deploy it:
$ kubectl apply -f deployment.yaml
Repeat this process for all four microservices, by creating a file for each and changing the container image and tags (basically replace "arrayify" with the other names).
At this point, you should be able to see all the deployments and containers running in your cluster.
$ kubectl get deployments
$ kubectl get pods
Exposing the microservices
If you've read my previous blog posts, you know the next step is to create a Kubernetes service for each microservice. This will create a stable endpoint and load balance traffic to each microservice.
However, you don't want to expose each service to the outside world individually. Each of the microservices is part of a singular API. If you expose each microservice individually, each microservice will have its own IP address, which you definitely don 't want.
Instead, use NGINX to proxy the microservices and expose a single endpoint. I’ll be using NGINX Plus, which is the paid version that comes with some goodies, but the open source version works just as well.
NGINX lets you do many things that're required to build a scalable API. By setting it up as an API Gateway, you can get fine grain control over the API, including rate limiting, security, access control and more. I'll configure the most basic NGINX setup required to get things working, and let you take things from there.
Creating internal services
The first step is to create internal services that you can proxy with NGINX. Here's the service for the arrayify microservice:
apiVersion: v1
kind: Service
metadata:
name: arrayify
spec:
ports:
- port: 80
targetPort: 80
protocol: TCP
selector:
name: arrayify-pods
The target for this service is port 80 on all pods with the "arrayify-pods" tag. Save this in a file called "service.yaml" and deploy it with the following command:
$ kubectl create -f service.yaml
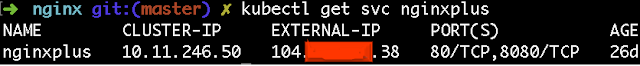
Again, do this for all four microservices. Create a file for each and change the tags (basically replace "arrayify" with the other names).
At this point, you should be able to see all your services running in your cluster.
$ kubectl get svc
Configuring NGINX
The next step is to configure NGINX to proxy the microservices. Check out the NGINX folder in github for all the details.
I’m going to focus on the nginx.conf file, which is where you configure NGINX.
Let’s look at the first line:
resolver 10.11.240.10 valid=5s;
This line sets up the DNS service that NGINX will use to find your microservices. This might not be necessary for your cluster, but I found it's safer to include this line. You might be curious about where this IP address comes from. It’s the DNS service built into Kubernetes. If you have a custom DNS setup, you can find the IP address for your cluster with this command.
$ kubectl get svc kube-dns --namespace=kube-system
Next, you need to set up the upstreams. An upstream is a collection of servers that do the same thing (i.e., a microservice). Because you can use DNS, this is fairly easy to set up. Here's the upstream for the arrayify microservice.
upstream arrayify-backend {
zone arrayify-backend 64k;
server arrayify.default.svc.cluster.local resolve;
}
Arrayify.default.svc.cluster.local is the Fully Qualified Domain Name for our kubernetes service. Repeat the process for all four microservices (basically replace "arrayify" with the other names).
Moving on to the server block. This is where you tell NGINX which paths need to be redirected to which microservice. Let’s take a look:
server {
listen 80;
status_zone backend-servers;
location /arrayify/ {
proxy_pass http://arrayify-backend/;
}
}
Here, you're telling NGINX that any request that starts with ‘/arrayify/’ should be passed to the arrayify microservice. Create a location block for all four microservices (basically replace "arrayify" with the other names).
Take a look at the full nginx.conf file for details.
Then, build and push out the custom NGINX image just like the other microservices. Again, check out the folder on GitHub for all the details.
Exposing NGINX
The final step is to expose NGINX publically. This is the same process as creating an internal service for your microservice, but you specify "type: LoadBalancer", which will give this service an external IP. You can see this in the svc.yaml file in the NGINX folder.
Once you deploy this service, you can get the external IP address with this command:
Trying it out
Now go to the External IP and test out the unified API endpoint to see the results. Pretty cool stuff!
Overview
To recap, this is what we built:
We use NGINX to expose a single API endpoint and proxy traffic to four different microservices, each having three instances. Woot!
Extra reading: scaling, updating and monitoring
At this point you have everything up and running. Let’s take a quick look at how you can monitor, scale and update your microservice.
Scaling
Scaling your microservices with Kubernetes couldn’t be easier. Let’s say you wanted to scale up the number of Arrayify containers running in your cluster. You can use the following command to scale up to five containers:
$ kubectl scale deployment arrayify --replicas=5
Scaling down is the same. If you want to scale the service down to one container, run the following command:
$ kubectl scale deployment arrayify --replicas=1
You can also turn on autoscaling. This dynamically resizes the number of containers in your cluster depending on CPU load. To do this, use the following command:
As you'd expect, this will ensure a minimum of one container always exists, and will scale up to five containers if necessary. It will try to make sure each container is at about 80% CPU utilization.
Being able to update your microservices with zero downtime is a big deal. Different parts of an app depend on various microservices, so if one microservice is down, it can have a negative impact on many parts of the system.
Thankfully, Kubernetes makes zero downtime deployments of microservices much more manageable.
To update a microservice, first build a new container with the new code, and give it a new tag. For example, if you want to update the "arrayify" microservice, rerun the same Docker build command, but bump the version from 0.1 to 0.2
Now, open your "deployment.yaml" file for the arrayify microservice, and change the container version from 0.1 to 0.2. Now you can deploy the new version.
$ kubectl apply -f deployment.yaml
Kubernetes will scale the new version up while scaling the old version down automatically!
If the new version has a bug, you can also roll back with a single command:
$ kubectl rollout undo deployment/arrayify
(Replace "arrayify" with the name of the microservice you want to update or rollback.)
To read more about all the things you can do with Kubernetes deployments, check out the docs.
Monitoring
Using NGINX Plus, you get a cool dashboard where you can see the live status of each microservice.
You can see the traffic, errors, and health status of each individual microservice. See the NGINX config file to see how to set this up.
Finally, I also highly recommend using Google Stackdriver to set up automatic alerts and triggers for your microservices. Stackdriver is a one-stop shop for monitoring your application. By default, the stdout and stderr of each container is sent to Stackdriver Logging. Stackdriver Monitoring can also look into our Kubernetes cluster and monitor individual pods, and Stackdriver Debugging can help debug live production code without performance hits.
If you’ve made it this far, thanks for sticking with me all the way to the end. Let me know what you think about this tutorial or other topics you’d like me to cover. You can find me on Twitter at @SandeepDinesh.
Posted by Alex Barrett, Editor, Google Cloud Platform Blog
One of the many tools that sets Google Cloud Platform apart from other cloud providers is Google BigQuery, a managed data warehouse service that allows users to query petabyte-scale datasets with a familiar SQL-like interface.Read More
Posted by Alex Barrett, Editor, Google Cloud Platform Blog
One of the many tools that sets Google Cloud Platform apart from other cloud providers is Google BigQuery, a managed data warehouse service that allows users to query petabyte-scale datasets with a familiar SQL-like interface.
Now it seems the broader cloud community is getting wind of how useful and useable BigQuery can be, and is working on ways to use it with workloads and datasets outside of GCP. This week, we read an interesting blog from Dominic Woodman about how he uses BigQuery for large-scale SEO processes such as doing an audit on a large number of internal links. The article is a must-read for more than just online marketers, though — it’s relevant to anyone who makes heavy use of Microsoft Excel. “What do you do when Excel fails?” Woodman writes. “Excel is a fantastic tool, but that doesn't mean it’s what we should use for everything.”
Now, we could use Splunk or fluentd or logstash or some other great service for doing this, but our client is familiar with BigQuery, they like the SQL interface, and they have other datasets stored there already. As a bonus, they could run their own reports instead of having to talk to developers (and nobody wants to do that, not even developers).
You should still read this article even if you’re not in the business of analyzing lots request logs. That’s because along the way, Jones also introduces a useful hack for avoiding egress charges as they move data out of AWS. These charges would have set them back $350/month, and avoiding extra charges is something that anyone working with multiple cloud providers can get behind.
We recently announced beta availability of Google Stackdriver, an integrated monitoring, logging and diagnostics suite for applications running on Google Cloud Platform and Amazon Web Services.Read More
Posted by Dan Belcher, Product Manager
We recently announced beta availability of Google Stackdriver, an integrated monitoring, logging and diagnostics suite for applications running on Google Cloud Platform and Amazon Web Services.1 Our customers have responded to the service with enthusiasm. While the service will be in beta for a couple more months, today we're sharing a preview of Google Stackdriver pricing.
By integrating monitoring, logging and diagnostics, Google Stackdriver makes ops easier for the hybrid cloud, equipping customers with insight into the health, performance and availability of their applications. We're unifying these services into a single package, which makes Google Stackdriver affordable, easy-to-use, and flexible. Here’s a high level overview of how pricing will work:
We’ll offer Free and Premium Tiers of Google Stackdriver.
The Free Tier will provide access to key metrics, traces, error reports and logs (up to 5GB/month) that are generated by Cloud Platform services.
The Premium Tier adds integration with Amazon Web Services, support for monitoring and logging agents, alert notifications (integration with Slack, HipChat, PagerDuty, SMS, etc.), custom metrics, custom logs, 30-day log retention and more.
The Premium Tier will be priced at a flat rate of $8.00 per monitored resource per month, prorated hourly. Each monitored resource adds 500 custom metric time series and 10GB of monthly log data storage to an account-wide quota. Each project also receives 250 custom metric descriptors. Billable resources map roughly to virtual machine instances and their equivalents, as described here.
For more details on the Free and Premium Tiers, please refer to the Google Stackdriver pricing FAQ, and watch this blog for more exciting Stackdriver news in the coming months!
1 "Amazon Web Services" and "AWS" are trademarks of Amazon.com, Inc. or its affiliates in the United States and/or other countries.
Stackdriver Debugger has always worked with source code stored in the Google Cloud Source Repository, or even source in local files, without having to upload it to Google servers. Recently, we’ve also heard from you that you want to use Debugger with code stored in other source repositories.Read More
Posted by Sharat Shroff, Product Manager
Stackdriver Debugger has always worked with source code stored in the Google Cloud Source Repository, or even source in local files, without having to upload it to Google servers. Recently, we’ve also heard from you that you want to use Debugger with code stored in other source repositories.
Today, we're happy to announce that Stackdriver Debugger can use source directly from Github or Bitbucket. No need to copy or replicate the source to Google Cloud Source Repository.
Simply authorize access the first time you connect your repositories to display and view source. The debugger will automatically display the correct version of the source code for your application when you follow the debugger deployment steps.
(click to enlarge)
Note that your source is not uploaded to Google when you connect your Github or Bitbucket repository. Permissions to access the repository can be revoked at any time from the Github or Bitbucket admin pages.
For more information, see Stackdriver Debugger setup documentation for App Engine and Compute Engine. And to learn more about Stackdriver Debugger, please visit the Debugger page. Give it a whirl and let us know if you like it.
Posted by Alison Wagonfeld, Vice President of Marketing, Google Cloud & Google for Education
We are excited to announce Google Cloud Platform Education Grants for computer science faculty and students. Starting today, faculty in the United States who teach courses in computer science or related subjects can apply for free credits for students to use across the full complement of Google Cloud Platform tools, without having to submit a credit card. These credits can be used anytime during the 2016-17 academic year.
Cloud Platform already powers innovative work by young computer scientists. Consider the work of Duke University undergrad Brittany Wenger. After watching several women in her family suffer from breast cancer, Brittany used her knowledge of artificial intelligence to create Cloud4Cancer, an artificial neural network built on top of Google App Engine. Medical professionals upload scans of benign and malignant breast cancer tumors. From these inputs, Cloud4Cancer has learned to distinguish between healthy and unhealthy tissue, providing health care professionals with a powerful diagnostic tool in the fight against cancer.
Familiarizing students with Cloud Platform will also make them more competitive in the job market. Professor Majd Sakr is a teaching professor in the Department of Computer Science at Carnegie Mellon University. In his experience, students that have access to public cloud infrastructure gain valuable experience with the software and infrastructure used by today’s employers. In addition, student projects can benefit from the sheer scale and scope of Google Cloud Platform’s infrastructure resources.
Google Cloud Platform offers a range of tools and services that are unique among cloud providers, for example:
Google App Engine is a simple way to build and run an application without having to configure custom infrastructure.
Google BigQuery is a fully managed cloud data warehouse for analyzing large data sets with a familiar, SQL-like interface.
Cloud Vision API allows computer science students to incorporate Google’s state-of-the-art image recognition capabilities into the most basic web or mobile app.
Cloud Machine Learning is Google’s managed service for machine learning that lets you build machine learning models on any type or size of data. It’s based on TensorFlow, the most popular open-source machine learning toolkit on GitHub, which ensures your machine learning is not locked into our platform.
We look forward to seeing the novel ways computer science students use their Google Cloud Platform Education Grants, and are excited to share their work on this blog.
Computer science faculty can apply for Education Grants today. These grants are only available to faculty based in the United States, but we plan to extend the program to other geographies soon. Once submissions are approved on our end, faculty will be able to disperse credits to students. For US-based students out there interested in taking GCP for a spin, encourage your department to apply! If you want to get started immediately, there’s also our free-trial program.
Students and others interested in Google Cloud Platform for Higher Education should complete the form to register their interest and stay updated about the latest from Cloud Platform, including forthcoming credit programs. For more information on GCP and its uses for higher education, visit our Cloud Platform for Higher Education webpage.
Posted by Sandeep Parikh, Cloud Solutions Architect
We like to think that Google Cloud Platform is one of the best places to run high-performance, highly-available database deployments and MongoDB is no exception. In particular, with an array of ...Read More
Posted by Sandeep Parikh, Cloud Solutions Architect
Provisioning Compute Engine instances and using MongoDB Cloud Manager to install, configure and manage MongoDB deployments
Today we’re taking things one step further and introducing updated documentation and Cloud Deployment Manager templates to bootstrap MongoDB deployments using MongoDB Cloud Manager. Using the templates, you can quickly deploy multiple Compute Engine instances, each with an attached persistent SSD, that will download and install the MongoDB Cloud Manager agent on startup. Once the setup process is complete, you can head over to MongoDB Cloud Manager and deploy, upgrade and manage your cluster easily from a single interface.
By default, the Deployment Manager templates are set to launch three Compute Engine instances for a replica set, but they could just as easily be updated to launch more instances if you’re interested in deploying a sharded cluster.
Check out the documentation and sample templates to get started deploying MongoDB on Cloud Platform. Feedback is welcome and appreciated; comment here, submit a pull request, create an issue or find me on Twitter @crcsmnky and let me know how I can help.